Bitcoin Technical Analysis: Insights into Market Trends
Bitcoin Technical Analysis: Insights into Market Trends
As of late 2023, the cryptocurrency market continues to be a hotbed for investors, with Bitcoin consistently leading the charge. Recent statistics reveal that Bitcoin remains the dominant cryptocurrency, holding around 42% of the total market capitalization. With the ongoing fluctuations, understanding Bitcoin technical analysis has never been more crucial for both new and seasoned investors.
Understanding Bitcoin Technical Analysis
Before diving deep into Bitcoin technical analysis, it’s essential to grasp its fundamentals. Technical analysis involves evaluating past price movements and trading volumes to forecast future price action. Unlike fundamental analysis, which focuses on a cryptocurrency’s intrinsic value, technical analysis provides insights based on market psychology and price patterns.
The Importance of Charts
Charts are vital tools in technical analysis. They offer a graphical representation of price movements. Here are common chart types used in Bitcoin analysis:

- Line Charts: Simple representation connecting closing prices over a specific period.
- Bar Charts: Displays opening, closing, high, and low prices, providing a comprehensive view.
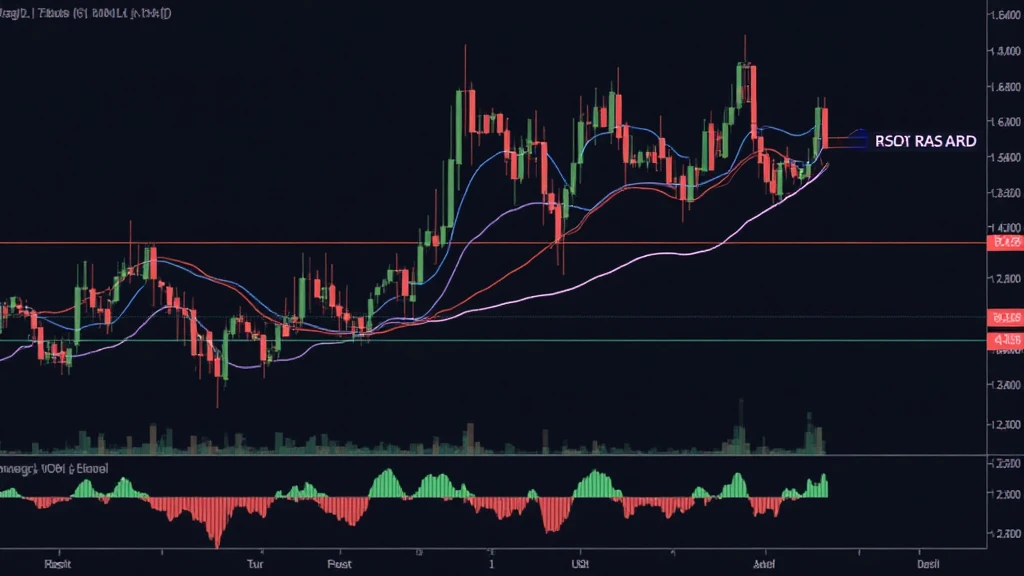
- Candlestick Charts: Offers detailed information, including market sentiment and price ranges, essential for discerning short-term trends.
These tools allow traders to identify patterns, making it easier to make informed decisions.
Key Indicators in Bitcoin Analysis
Traders use various indicators to interpret market data. The frequency of certain trading signals may help to decide when to buy or sell. Here are some key indicators utilized in Bitcoin technical analysis:
- Moving Averages (MA): MAs smooth out price fluctuations, helping traders to identify trends. Common approaches include the Simple Moving Average (SMA) and the Exponential Moving Average (EMA).
- Relative Strength Index (RSI): RSI helps assess whether Bitcoin is overbought or oversold, with values above 70 indicating overbought conditions and below 30 indicating oversold scenarios.
- MACD (Moving Average Convergence Divergence): This indicator reveals changes in momentum by comparing two moving averages, signaling potential price reversals.
By employing these indicators, traders can gauge market conditions more accurately.
Current Trends and Market Sentiment
As of late 2023, the Bitcoin market shows considerable volatility, primarily influenced by macroeconomic factors such as inflation rates and government policies. For instance, recent data from Chainalysis states that in Q3 2023, Bitcoin’s volatility index surged by 25%, reflecting the market’s sensitivity to news about regulatory developments.
Moreover, social media sentiment has a significant impact on Bitcoin’s price actions. Recent analysis found that mentions of Bitcoin on platforms like Twitter and Reddit correspond with price surges. It is vital for traders to monitor sentiment as part of their technical analysis strategy.
Market Predictions for 2024
Looking ahead, some analysts project that Bitcoin could reach new heights based on the ongoing adoption of cryptocurrencies. By leveraging data and technical analysis, investors can position themselves strategically. For instance, predictions suggest that Bitcoin might test the $75,000 mark by the end of 2024, offering significant opportunities for traders.
Case Study: Bitcoin’s Price Movement in September 2023
Analyzing the price movements of Bitcoin in September 2023 offers valuable insights. During this period, Bitcoin experienced a drop from $35,000 to $28,000, which can be attributed to external economic factors and regulation fears.
| Date | Price |
|---|---|
| September 1 | $35,000 |
| September 15 | $30,000 |
| September 30 | $28,000 |
These movements reflect how external economic conditions can sway Bitcoin’s market behavior. Traders who used technical analysis were able to observe signs of weakness through indicators like RSI, allowing them to adjust their strategies accordingly.
Conclusion: Navigating Bitcoin’s Landscape with Technical Analysis
Bitcoin continues to be a significant player in the cryptocurrency space. As we move into 2024, understanding Bitcoin technical analysis will remain a vital tool for traders and investors. This analytical framework not only assists in making informed decisions but also helps assess market sentiment and implement trading strategies effectively.
By continuously refining technical analysis skills and keeping abreast of market trends, investors can maximize their opportunities in this dynamic environment.
As the Vietnamese cryptocurrency market expands, with a reported growth rate of 120% among users, employing technical analysis could be crucial for local investors looking to capitalize on Bitcoin’s market movements. Whether navigating through volatile phases or optimizing investment strategies, technical analysis remains indispensable.
For more updates, insights, and tools for your cryptocurrency journey, visit TechCryptoDigest.
Author: Dr. Alex Yoon – A blockchain security expert with over 30 published papers in cryptocurrency markets and a lead auditor for several prominent cryptocurrency projects.


