Technical Analysis Crypto Indicators: Unlock Your Trading Potential

Technical Analysis Crypto Indicators: Unlock Your Trading Potential
With over $4.1 billion lost to DeFi hacks in 2024, understanding the right tools for crypto trading has never been more critical. Among these tools, technical analysis crypto indicators play a vital role in guiding traders towards informed decisions. This article explores the importance of these indicators, their functionality, and how you can leverage them for success in the dynamic world of cryptocurrency.
Understanding Technical Analysis in Cryptocurrency
Technical analysis is the study of past market data, primarily price and volume, to forecast future price movements. This method has gained immense popularity within the cryptocurrency trading community, as the market’s volatility offers ample opportunities for profit. The essence of technical analysis lies in using various crypto indicators that provide insights into market trends.
Why Use Technical Analysis?
- Helps identify trends and reversals.
- Aids in timing entries and exits.
- Facilitates risk management through stop-loss orders.
- Enhances decision-making based on data rather than emotions.
Popular Technical Analysis Crypto Indicators
Traders utilize a range of indicators to tap into market sentiments and potential price movements. Here are some of the most used indicators in crypto trading.
1. Moving Averages
Moving averages (MA) smooth out price data to identify the direction of the trend. The two most common types are:
- Simple Moving Average (SMA): Calculates the average price over a specific number of periods.
- Exponential Moving Average (EMA): Gives more weight to recent prices, making it more responsive to new information.
Traders often watch for crossovers, where a short-term MA crosses above or below a long-term MA, signaling potential buy or sell opportunities.
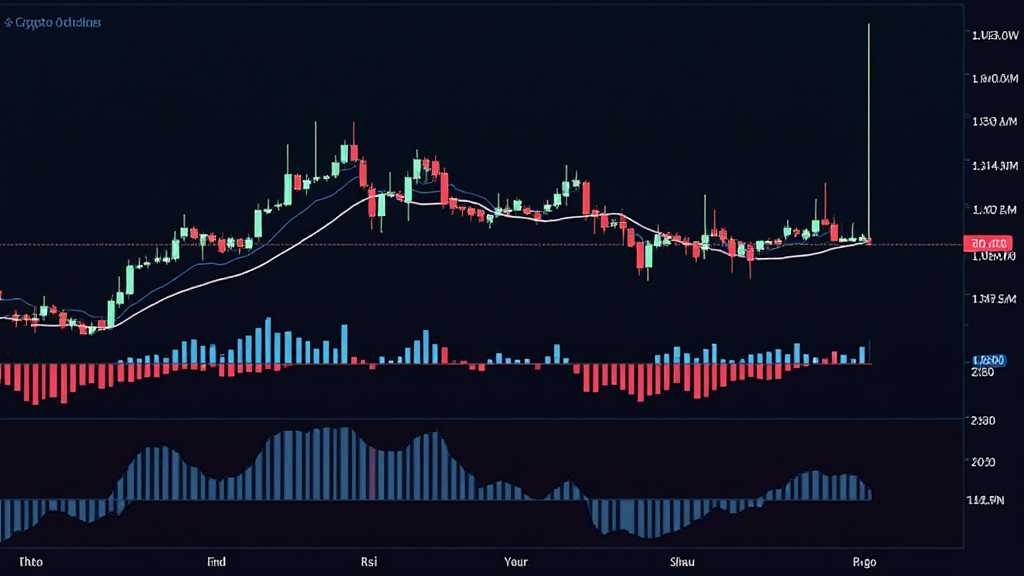
2. Relative Strength Index (RSI)
The RSI is a momentum oscillator that measures the speed and change of price movements, operating on a scale of 0 to 100. A reading above 70 indicates that an asset is overbought, while a reading below 30 suggests it is oversold. This indicator helps traders determine potential reversal points.
3. Bollinger Bands
Bollinger Bands consist of a middle band (SMA) and two outer bands that represent volatility. The bands widen or contract based on market conditions. When prices touch the upper band, it may indicate overbought conditions, while prices touching the lower band signify oversold conditions. This information can help traders make informed decisions about entry and exit points.
4. MACD (Moving Average Convergence Divergence)
MACD is another trend-following momentum indicator that shows the relationship between two EMAs. It consists of:
- MACD Line: The difference between the 12-period and 26-period EMAs.
- Signal Line: The 9-period EMA of the MACD Line.
Traders look at crossovers between the MACD Line and the Signal Line to make trading decisions.
Case Study: Technical Indicators in Action
Let’s break it down through a real trading scenario. Suppose a trader uses the RSI and MACD indicators on Bitcoin over a two-week trading period:
- RSI shows an overbought condition at 75, and the MACD is poised for a bearish crossover.
- The trader decides to sell half of their position, securing profits while managing risk.
- A week later, the RSI drops to 30, and the MACD indicates a bullish crossover.
- The trader re-enters at this point, taking decisive action based on solid data.
Practical Tips for Using Technical Indicators
- Combine multiple indicators for enhanced reliability.
- Don’t rely solely on indicators; account for market news and events.
- Test your strategy using historical data before applying it in live trading.
Conclusion
Mastering technical analysis crypto indicators is essential for trading success in the ever-evolving cryptocurrency landscape. By utilizing these tools effectively, traders can identify trends, manage risks, and make informed decisions. Remember, the crypto market can be unpredictable, so always conduct thorough research and consider multiple factors before making any trading decisions.
For those interested in advancing their trading skills and understanding market dynamics, resources like hibt.com offer valuable insights. And remember, while these indicators can guide your strategy, they should not replace sound judgment and prudent risk management.
As you progress in your trading journey, keep honing your skills and adapting your strategies based on the market environment.
**Expert Author:** Dr. Nguyen Minh, a leading analyst with over 20 published papers in blockchain technology and has spearheaded compliance audits for various high-profile cryptocurrency projects.