Understanding Bitcoin Price Chart Patterns: A Comprehensive Analysis

Understanding Bitcoin Price Chart Patterns: A Comprehensive Analysis
As the world of cryptocurrency continues to evolve, Bitcoin remains at the forefront of digital currencies, captivating traders and investors alike. In recent years, Bitcoin has witnessed unprecedented volatility, making it imperative for participants to understand the intricacies of its price movements. This article delves into the significance of Bitcoin price chart patterns, providing insights and analytical frameworks that can enhance trading strategies and investment decisions.
Why Bitcoin Price Chart Patterns Matter
With statistics revealing that 2021 saw a massive growth in Bitcoin’s price, skyrocketing from under $30,000 to over $60,000, understanding Bitcoin price chart patterns is vital for predicting potential trends and movements.
- Chart patterns often signal market sentiment, assisting traders in making informed decisions.
- Identifying these patterns can lead to improved entry and exit points.
- Patterns serve as a roadmap for navigating volatile markets.
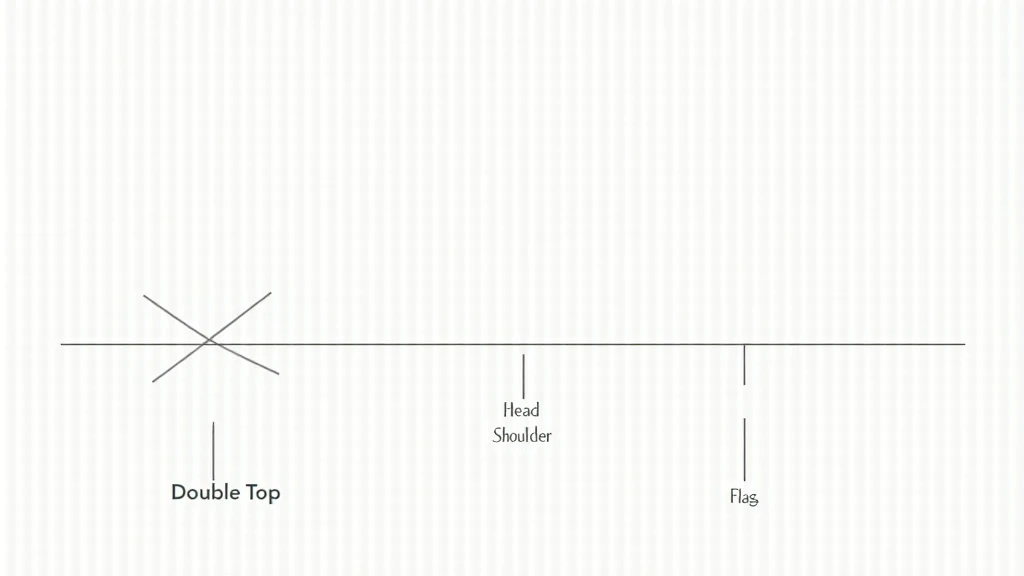
Types of Bitcoin Price Chart Patterns
The landscape of Bitcoin price chart patterns is diverse. Here, we explore some of the most notable ones:
1. Head and Shoulders
This pattern is a reversal formation that can indicate a shift in the trend from bullish to bearish. It appears as three peaks: a higher peak (head) between two lower peaks (shoulders). Identifying this pattern early can help traders secure profits before a market downturn.
2. Flags and Pennants
Flags resemble rectangular shapes, while pennants look like small triangles. Both patterns indicate a brief consolidation period followed by a continuation of the previous trend. Recognizing these patterns can lead to lucrative trading opportunities.
3. Double Tops and Bottoms
These patterns signify potential reversals. A double top appears after an uptrend, where the asset hits a resistance level twice before reversing. Conversely, a double bottom appears after a downtrend, indicating a potential bullish reversal.
Analyzing Chart Patterns: Technical Indicators
To enhance the analysis of Bitcoin price patterns, traders often use various technical indicators. Here’s a look at some popular tools:
- Moving Averages: Useful for smoothing price data and identifying trends.
- Relative Strength Index (RSI): Helps measure overbought or oversold conditions.
- MACD (Moving Average Convergence Divergence): Indicates momentum by showing the relationship between two moving averages.
The Importance of Market Context
While chart patterns provide valuable signals, understanding the broader market context is paramount. Factors such as news events, regulatory changes, and market sentiment play crucial roles in influencing Bitcoin’s price movement. The increased adoption of cryptocurrencies in Vietnam, where the local user growth rate surged by 43% in 2022, showcases how regional factors can impact global trends.
Case Studies: Bitcoin Price Movement Analysis
To better illustrate the effectiveness of these chart patterns, let’s examine a few historical examples of Bitcoin price movements:
- Case Study 1: In December 2017, Bitcoin) exhibited a classic double top pattern before experiencing a significant correction.
- Case Study 2: In 2020, the market saw a bullish pennant formation that preceded a price rally towards new all-time highs.
- Case Study 3: The head and shoulders pattern in 2021 foreshadowed a subsequent market downturn, emphasizing the predictive power of chart patterns.
Strategies for Trading Based on Chart Patterns
Successfully trading Bitcoin based on price chart patterns involves a blend of strategy, patience, and discipline. Consider these actionable strategies:
- Confirmation Signals: Wait for confirmation before executing trades, such as volume spikes or momentum indicators.
- Set Stop-Loss Orders: Protect capital by setting stop-loss orders when entering trades based on chart patterns.
- Backtesting: Employ historical data to assess how well a chart pattern would have performed in past markets.
The Future of Bitcoin and Price Chart Patterns
As Bitcoin continues to mature, the landscape of price chart patterns evolves. Innovations such as algorithmic trading and artificial intelligence are reshaping the analysis of market behaviors. Trading strategies will have to adapt to these changes to remain effective in forecasting price movements.
In conclusion, understanding Bitcoin price chart patterns serves as a critical tool for traders and investors alike. By recognizing these patterns, utilizing accompanying indicators, and adapting to market context, participants in the Bitcoin ecosystem can enhance their trading strategies and investment success.
As always, consult with local regulators and financial advisors before making investment decisions. This content does not constitute financial advice but serves as informative guidance based on current market observations.
Explore More Insights at TechCryptoDigest
For more in-depth discussions on cryptocurrency trading strategies and market updates, visit techcryptodigest. Stay ahead of the curve!