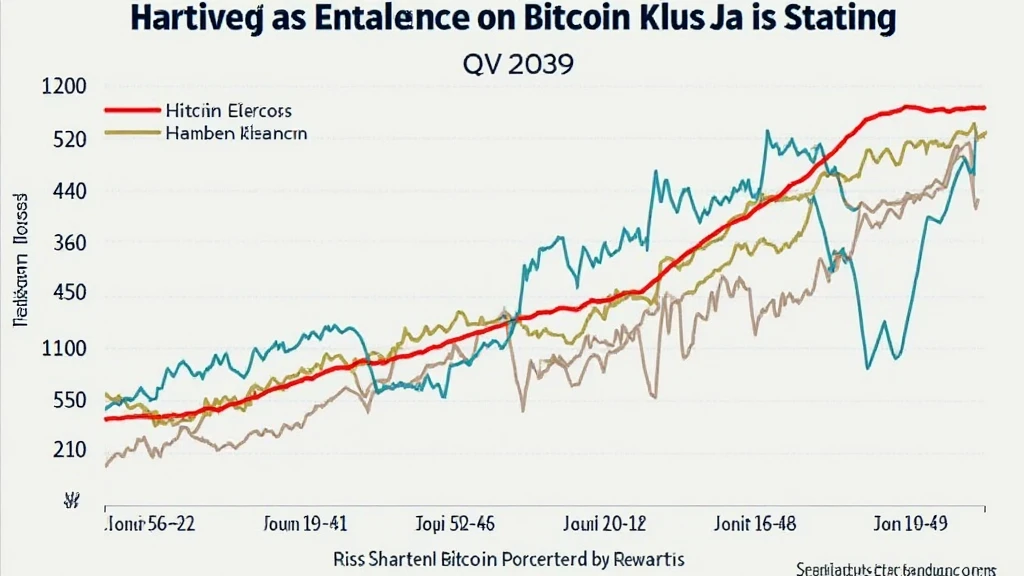
Understanding Bitcoin Halving Technical Indicators
Understanding Bitcoin Halving Technical Indicators
With the complex world of digital currencies continuing to grow, Bitcoin Halving technical indicators remain a critical point of analysis for both seasoned traders and newcomers alike. According to recent statistics, the adoption of cryptocurrencies in regions like Vietnam has increased by over 300% in the last year, highlighting a significant opportunity for investors. As the market evolves, understanding these indicators can provide leverage for decision-making in the trading landscape.
What is Bitcoin Halving?
Bitcoin halving is a process that occurs approximately every four years, specifically every 210,000 blocks mined. The reward that miners earn for adding a new block to the blockchain is cut in half. This mechanism is a critical aspect of Bitcoin’s monetary policy, designed to control inflation and limit the total supply to 21 million bitcoins.
To illustrate, consider this: when Bitcoin was launched in 2009, miners received 50 BTC for each block. After the first halving in 2012, this reward dropped to 25 BTC. The most recent halving occurred in May 2020, reducing the reward to 6.25 BTC. The next event is slated for 2024, where it will further decrease to 3.125 BTC.

The Economic Implications of Halving
- Price Trends: The expectation surrounding each halving often generates bullish sentiment, as scarcity tends to drive prices up.
- Mining Economics: As rewards decrease, miners may adjust their strategies. This could reshape the market’s supply dynamics.
Data from Chainalysis reveals that, historically, Bitcoin prices increase significantly in the months following a halving event. For instance, after the 2016 halving, the price surged from around $450 to nearly $20,000 within 18 months.
Key Technical Indicators for Trading Bitcoin
When analyzing the price movements of Bitcoin, several technical indicators are essential in interpreting trends and forecasting potential futures. Utilizing these indicators effectively often resembles how traders use weather forecasts to prepare for effective sailing; accuracy can make all the difference.
Moving Averages (MA)
Moving averages smooth out price data to help identify trends over a specific period. The two most common types are:
- Simple Moving Average (SMA): This is calculated by taking the average price over a specified number of periods.
- Exponential Moving Average (EMA): This gives more weight to the most recent price, making it more reactive to recent price changes.
In the context of Bitcoin halving, many traders look at the crossing points of the 50-day and 200-day MAs as critical signals for potential bull or bear markets.
Relative Strength Index (RSI)
The RSI measures the speed and change of price movements, oscillating between 0 and 100. A reading above 70 may indicate that Bitcoin is overbought, while a reading below 30 may indicate that it is oversold. Romero Analysis found that during previous halvings, Bitcoin’s RSI often fluctuated significantly, signaling potential entry or exit points for traders.
Volume Analysis
Volume refers to the number of coins that are traded during a given time period. It often serves as a confirmation of trends. Higher volumes during a price rise can indicate strong support for a price breakout. Conversely, a price increase with low volume may suggest uncertainty, resembling a boat sailing against the tide without fully embracing the upcoming current.
Local Market Trends: The Vietnamese Context
The Vietnamese cryptocurrency market is undergoing rapid changes. With a user growth rate of nearly 150% in one year according to recent reports, now is an opportune moment for traders and enthusiasts alike.
As seen in Vietnam, many traders are now focusing on the implications of Bitcoin halving. The local market, particularly in major cities like Ho Chi Minh City, has witnessed an increased interest in technical trading strategies, many of which rely on the indicators discussed.
Preparing for the Next Halving: A Strategic Approach
As we approach the next halving in 2024, traders should prepare by:
- Conducting comprehensive research on historical data to identify patterns.
- Monitoring key indicators like moving averages, RSI, and volume to stay ahead of market movements.
- Engaging with local crypto communities to share insights and strategies.
Incorporating insights and adapting quickly to the rapidly shifting market conditions continue to be essential for achieving success in the world of Bitcoin trading.
Conclusion
The impact of Bitcoin halving on technical indicators cannot be overstated. Understanding how to interpret these indicators can empower traders to make informed decisions. As the market evolves, keeping a pulse on developments and adapting strategies accordingly will be vital.
Anticipating the upcoming halving and utilizing key technical indicators will provide necessary tools for navigating this volatile digital currency landscape effectively. Remember, investing in cryptocurrencies carries risks, so it’s advisable to consult with local regulators and professionals before making any financial decisions.
For more insights into cryptocurrency trends, visit techcryptodigest.


