Essential Bitcoin Price Chart Analysis Tools

Essential Bitcoin Price Chart Analysis Tools
As the cryptocurrency market continues to evolve, the need for effective tools to analyze Bitcoin price chart analysis tools becomes more pressing. Recent data reveals that the global cryptocurrency market cap reached over $2 trillion in early 2023, illustrating the potential for significant returns on investment. However, with the rise in popularity comes the necessity for informed trading decisions. Utilizing the right analysis tools can be the difference between successful trades and costly mistakes.
Your Guide to Bitcoin Chart Analysis
Beginning your trading journey means understanding the fundamentals of price chart analysis. Bitcoin price chart analysis tools provide visual representations of price movements that can help traders predict future trends. By examining historical data, traders can recognize patterns and make educated decisions based on market behavior.
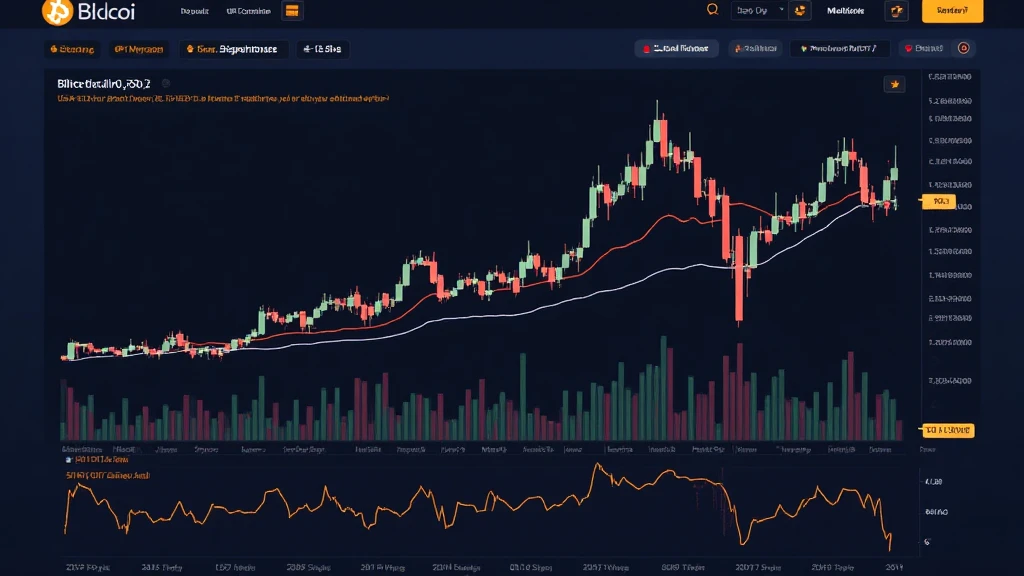
Why Use Chart Analysis Tools?
- Gain Insight: Tools provide deeper insights into market trends.
- Visual Clarity: Charts can simplify complex data, making it easier to understand.
- Improve Timing: Chart analysis can help determine optimal entry and exit points.
Popular Bitcoin Price Chart Analysis Tools
When it comes to selecting Bitcoin price chart analysis tools, several options stand out. These tools not only provide technical indicators but also come with various features that cater to both novice and experienced traders.
1. TradingView
TradingView is one of the most popular analysis platforms among traders. Its user-friendly interface allows for extensive customization, making it easy to incorporate different technical indicators and drawing tools. From Fibonacci retracements to moving averages, TradingView supports a wide range of assets, including Bitcoin.
2. Coinigy
Coinigy is another comprehensive tool that provides real-time price data and charting for Bitcoin and altcoins. With seamless API integrations to numerous exchanges, Coinigy allows you to manage multiple accounts from one interface, making it a favorite for serious traders.
3. CryptoCompare
CryptoCompare offers a variety of crypto data and tools, including detailed price charts and historical data analysis. Its charting feature enables users to compare different cryptocurrencies against Bitcoin, making it easier to spot potential trading opportunities.
4. CoinMarketCap
While primarily known for tracking the market capitalization of various cryptocurrencies, CoinMarketCap also provides a basic charting feature. It’s a great tool for quick insights and for beginners just starting out with Bitcoin price chart analysis.
Understanding Market Trends: Bullish vs. Bearish
Chart analysis tools help you identify market trends. Understanding whether a market is bullish or bearish is crucial for your trading strategy.
- Bullish Trends: Characterized by rising prices, a bullish trend indicates a strong market sentiment. Traders often look for upward price patterns to establish long positions.
- Bearish Trends: Conversely, a bearish trend indicates declining prices. Traders may decide to short-sell assets during this period, recognizing downward price patterns.
Incorporating Indicators in Your Analysis
Indicators enhance your analysis by providing critical insights regarding price movements.
1. Moving Averages
One of the simplest and most widely used indicators, moving averages help smooth out price actions to identify trends. They can be simple or exponential and are particularly useful in identifying support and resistance levels.
2. Relative Strength Index (RSI)
RSI measures the speed and change of price movements, helping traders identify overbought or oversold conditions. An RSI above 70 indicates an overbought condition, while below 30 suggests oversold.
Making Data-Driven Decisions
Using Bitcoin price chart analysis tools to track price movements and market trends can create a robust trading strategy. Analyze price data in conjunction with market news to validate your conclusions.
The Rise of Bitcoin in Vietnam
With a growing interest in cryptocurrencies, Vietnam has seen a surge in Bitcoin adoption. According to recent studies, the number of cryptocurrency users in Vietnam is expected to grow by 100% by the end of 2023. This indicates that more traders are looking for reliable Bitcoin price chart analysis tools.
Conclusion
As the cryptocurrency landscape continues to grow, utilizing effective Bitcoin price chart analysis tools is essential for making informed trading decisions. These tools not only simplify the complex data surrounding Bitcoin transactions but also open doors to strategic opportunities within the evolving market.
Whether you’re a novice trader or a seasoned investor, integrating these tools into your trading arsenal can significantly enhance your market analysis capabilities and prepare you for future trading successes. Stay ahead of the curve with the right tools at your disposal.