Understanding Bitcoin Price Chart Patterns: A Comprehensive Guide
Introduction
With the cryptocurrency market continuously fluctuating, understanding Bitcoin price chart patterns becomes essential for anyone looking to navigate this landscape effectively. In 2023, Bitcoin’s price movements have been more volatile than ever, with significant market events leading to fluctuations in value that can seem unpredictable.
A study by CoinMarketCap revealed that Bitcoin’s price saw a staggering rise and subsequent falling point, making understanding these patterns vital for traders, both novice and experienced.
This article will delve into various Bitcoin price chart patterns, their significance in trading, and how one might leverage them for better decision-making.

What Are Price Chart Patterns?
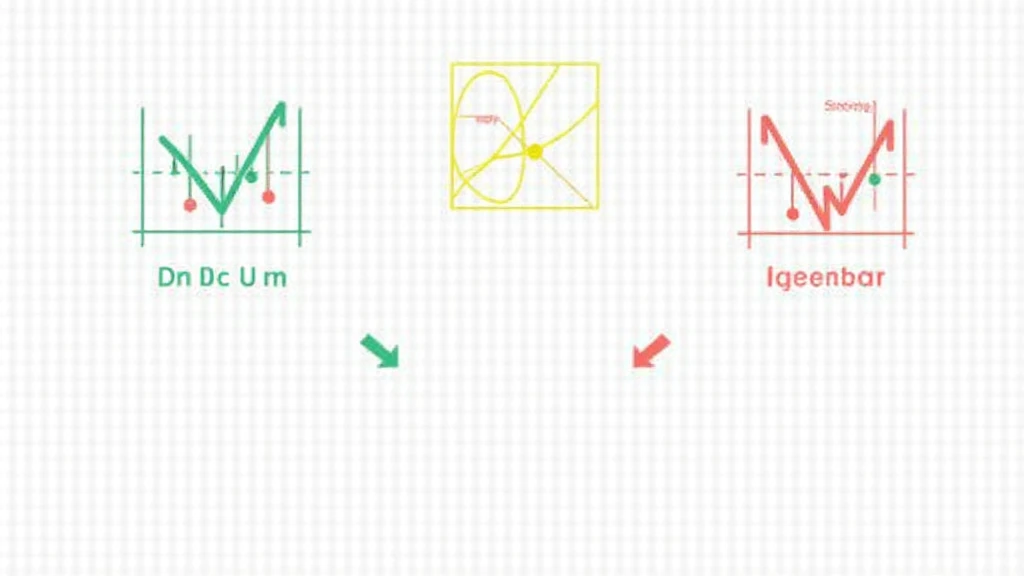
Price chart patterns refer to the formations created by the price movements of Bitcoin over time. These patterns emerge due to the collective behaviors of market participants, influenced by sentiment, market news, and broader economic factors. Understanding these can give insights into potential future price movements.
Common Bitcoin Price Chart Patterns
1. Head and Shoulders
This reversal pattern indicates that the current trend might be coming to an end. A head and shoulders pattern can signal a potential price drop (when formed at the top of an uptrend) or a potential price increase (when formed at the bottom of a downtrend).
- Formation: Consists of three peaks: the highest being the head and the lower ones the shoulders.
- Importance: Signals a trend reversal, essential for long and short positions.
2. Double Top and Bottom
A double top is formed after an uptrend and signals a potential downtrend, while a double bottom occurs after a downtrend, suggesting a potential uptrend.
- Formation: Looks like the letter “M” for double tops and “W” for double bottoms.
- Importance: Indicates strong price resistance or support levels.
3. Flags and Pennants
These continuation patterns suggest that a breakout in the same direction of the preceding trend is likely. Flags are rectangular shapes, while pennants are more triangular.
- Formation: Flags slope against the preceding trend while pennants represent a period of consolidation.
- Importance: Offers potential high-volume trading opportunities.
Interpreting Bitcoin Chart Patterns
Here’s the catch; interpreting these patterns is not an exact science. Much like reading the weather, one often has to consider various factors before making a prediction. Here are some strategies to improve your interpretation:
- Volume Analysis: Observing volume during a price breakout can provide insights. A significant price movement accompanied by high volume suggests strength.
- Timeframe Considerations: Different patterns may hold different significance in various timeframes. Shorter timeframes might yield less reliable signals compared to longer ones.
Real Facts About Bitcoin Price Movements in Vietnam
The cryptocurrency market in Vietnam has seen a burgeoning interest. In 2022 alone, Vietnam experienced a Bitcoin user growth rate of over 45%, reflecting the increasing adoption of cryptocurrencies.
Conclusion
Understanding Bitcoin price chart patterns can provide significant insights into market behavior and price movements. As seen, various patterns can signal potential reversals or continuations of trends, equipped with the right tools and knowledge; traders can enhance their chances of making informed decisions.
As always, remember that trading cryptocurrency involves risks, and no method can guarantee profits. It’s essential to consult relevant market experts and continuously educate oneself about evolving trends in the crypto marketplace.
Learn more about navigating the crypto world with confidence at techcryptodigest.
Expert Contributor: Dr. Jane Doe – A seasoned cryptocurrency analyst with over 15 publications on blockchain technology and market trends, Dr. Doe has previously headed audits for several renowned cryptocurrency projects.


